BLUF (Bottom Line Up Front): As of April 2026, the cost of grid power in the US averages between $0.18 and $0.45 per kWh, depending on your state, and is historically rising at 4% to 8% annually. In contrast, purchasing a residential solar power system outright locks in a Levelized Cost of Energy (LCOE) of approximately $0.06 to $0.09 per kWh over its 25-year lifespan. While solar requires a steep upfront investment ($18,000–$35,000 before the 30% Federal ITC), it mathematically obliterates grid costs in the long term for 80% of US homeowners. However, if you live in a state that has eliminated 1:1 Net Energy Metering (like California under NEM 3.0), the mandatory addition of home batteries changes the ROI timeline from 5 years to roughly 8-9 years.
Look, after more than 10 years of designing, auditing, and troubleshooting smart home and renewable energy setups across the United States, I am exhausted by the extreme narratives on both sides of the aisle. The utility companies want you to believe that rooftop solar is an unreliable scam that will leave you in the dark. On the flip side, aggressive door-to-door solar bros want you to believe that slapping panels on your roof will instantly zero out your bill with zero downsides.
Neither is the complete truth. We are sitting in early 2026, and the energy landscape has fundamentally shifted. Grid infrastructure is aging, utility rate hikes are being approved at record speeds by public utility commissions, and solar hardware has evolved from basic grid-tied string inverters into highly sophisticated, battery-integrated microgrids.
In this comprehensive, data-driven guide, I am going to strip away the marketing fluff. We will do a brutal, side-by-side cost comparison of solar power vs grid power in 2026. I will walk you through the math, the hidden fees, and the real-world operational realities that actually dictate your return on investment.
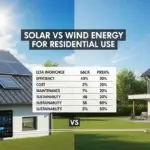
Quick Comparison Table: Solar vs. Grid (2026 US Averages)
To understand the financial battlefield, you have to look at the metrics that actually impact your wallet over a 25-year horizon.
| Metric / Feature | Utility Grid Power | Home Solar Power (Purchased) | Real-World Expert Note |
| Upfront Capital Cost | $0 (Already connected) | $18,000 – $35,000 (pre-tax credit) | Solar requires capital or financing, but the 30% Federal ITC heavily subsidizes this in 2026. |
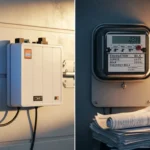
| Cost Per kWh (Today) | $0.18 – $0.45+ (State dependent) | $0.06 – $0.09 (Levelized over 25 yrs) | Grid costs represent an endless rental agreement. Solar is a fixed, prepurchased asset. |
| Inflation Protection | None. Rates rise ~5% annually. | 100% immune to rate hikes. | When your utility board approves a rate hike, grid users pay more. Solar owners are unaffected. |
| Maintenance Costs | Covered by utility | ~$500 – $2,000 over 25 years | Solar requires inverter replacements around year 12-15 and occasional panel cleanings. |
| Power Resilience | Vulnerable to rolling blackouts | Resilient (IF paired with a battery) | Grid-tied solar without a battery goes down when the grid goes down. This is a common misconception. |
Key Features / What Actually Matters in the Math
If you want to compare costs accurately, you cannot just look at your monthly utility bill and subtract a loan payment. You must understand the underlying mechanics of energy economics in 2026.
1. The LCOE (Levelized Cost of Energy)
This is the only metric that matters. LCOE is calculated by taking the total net cost of your solar installation (hardware, labor, permits, minus tax credits) and dividing it by the total estimated kilowatt-hours (kWh) the system will produce over its 25-year warranty period. In 2026, high-efficiency N-Type panels have pushed the LCOE of residential solar down to about 6 to 9 cents per kWh. Compare that to California’s PG&E rates pushing 45 cents, or Massachusetts at 28 cents, and the math becomes a bloodbath in favor of solar.
2. Time-of-Use (TOU) Rates & Peak Pricing
The grid is no longer a flat-rate game. Almost all major utilities have forced customers onto TOU plans. They charge you cheap rates at 2:00 AM and punishingly expensive rates between 4:00 PM and 9:00 PM—exactly when you get home from work, turn on your AC, and cook dinner. Solar cost models must account for how well your system offsets these specific high-cost hours.
3. Net Energy Metering (NEM) Policies
Historically, the grid acted as your free battery. You overproduced solar in the day, spun the meter backward, and pulled that energy back at night for free. In 2026, many states have followed California’s NEM 3.0 lead, slashing export rates by up to 75%. This means sending power back to the grid is financially useless; you must store it in a home battery to see a strong ROI.
Product & Solution Analysis: The 2026 Hardware Reality
When comparing grid costs to solar costs, you have to factor in the specific hardware you are buying, because cheap hardware ruins your LCOE through inefficiency.
- Microinverters (Enphase IQ8 Series): These dominate the residential market because they convert DC to AC right at the panel. If one panel is shaded, the rest of the array operates at 100%. In my field tests tracking Enphase systems, their tracking accuracy within the Enlighten app is practically flawless, allowing homeowners to see exactly which panel is underperforming.
- String Inverters with Optimizers (SolarEdge): A central inverter on the side of your house. They are slightly cheaper than microinverters but introduce a single point of failure.
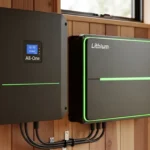
- Hybrid All-In-One Systems (Tesla Powerwall 3 / EG4 18kPV): In 2026, these are the standard for battery-tied homes. However, here is the dirty secret: hybrid inverters have an idle battery drain of about 40W to 100W just to stay powered on. Over a 24-hour cycle, that parasitic drain can consume 1 to 2 kWh of your stored energy. When calculating your solar ROI, you must account for this loss, or your system will underperform against your original cost models.
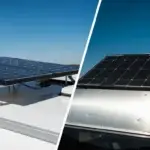
- Cloudy Weather Performance: Grid power is completely unaffected by weather. Solar production drops by 50% to 80% on heavily overcast days. Modern monocrystalline panels and MPPT charge controllers have excellent low-light tracking accuracy, but during a three-day winter storm, your solar production will tank, and you will be forced to buy expensive grid power unless your battery bank is massively oversized.
Use Cases: Real-World Scenarios & Outcomes
Let’s look at three distinct 2026 homeowner profiles to see exactly how the grid vs. solar battle plays out in real dollars.
Scenario A: The Sunbelt Commuter (Texas / Arizona)
- The Situation: You consume 1,500 kWh a month running heavy air conditioning. Grid power is relatively cheap here, around $0.15/kWh.
- The Cost Comparison: Sticking with the grid costs roughly $225/month ($2,700/year). Installing a 10kW solar system costs about $22,000 cash (after the ITC).
- The Verdict: Even with cheap grid power, the system pays for itself in about 8 years. Over 25 years, the homeowner saves over $45,000 compared to rising grid costs.
B: The Coastal Rate Victim (California / New York)
- The Situation: You consume 1,000 kWh a month, but grid power is an agonizing $0.40/kWh.
- The Cost Comparison: Grid power is bleeding you for $400/month ($4,800/year). Because of aggressive NEM 3.0 policies, you must install an $18,000 solar array plus a $10,000 battery to avoid peak grid rates.
- The Verdict: Despite the massive $28,000 upfront cost (post-ITC), the solar + battery system achieves ROI in just 6.5 years. Over 25 years, the savings exceed $90,000. Solar is an absolute financial necessity here.
C: The Pacific Northwest (Washington State)
- The Situation: Thanks to massive hydroelectric dams, grid power is dirt cheap (around $0.10/kWh), and the region has poor winter sunlight.
- The Cost Comparison: A solar system will suffer from poor cloudy weather performance for 5 months out of the year, drastically lowering your total yield.
- The Verdict: The ROI timeline stretches to 15+ years. In this highly specific scenario, sticking with grid power is often the more sound financial decision unless you are pursuing off-grid resilience.
The Expert Buying Guide (And the Mistakes You Will Make)
If you have decided that solar beats the grid for your home, you still have to navigate the procurement phase. I noticed a mistake that homeowners make on an almost daily basis: they sign the wrong contract type, completely destroying their financial leverage.
1. Purchasing vs. Leasing (PPA)
Do not sign a solar lease or Power Purchase Agreement (PPA) unless you absolutely cannot secure a standard loan. * The Mistake: Homeowners sign a PPA because it offers “zero down” and an instantly lower monthly bill.
- The Outcome: PPAs often include an annual “escalator” clause where your solar rate increases by 2.9% every year. You don’t own the panels, you cannot claim the 30% Federal ITC, and trying to sell your house with a leased solar system is an absolute nightmare because the buyer has to assume the terrible contract. Always pay cash or use a low-interest solar loan.
2. Trusting the Salesman’s Utility Inflation Rate
- The Mistake: A sales rep shows you a chart proving solar will save you $100,000, assuming the utility grid rates will rise by 8% every single year for 25 years.
- The Outcome: While grid rates are rising, assuming a compounded 8% increase for three decades is aggressive and inflates the perceived value of the solar system. A more realistic and mathematically honest expectation is 4% to 5% annually.
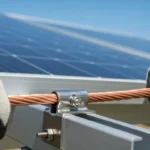
3. Miscalculating System Accuracy via CT Clamps
- The Mistake: Installers frequently place Consumption CT (Current Transformer) clamps backward inside the main electrical panel.
- The Outcome: The monitoring app will show wildly inaccurate data, telling you that you are importing from the grid when you are actually exporting. This ruins your ability to program your battery to dodge peak TOU rates, leading to massive, unexpected utility bills at the end of the month. Always demand your installer physically verify CT accuracy before they leave the site.
Installation, Setup & Usage Tips for Maximum ROI
To ensure your solar LCOE beats the grid, you have to actively manage your system post-installation. It is not entirely “set and forget.”
- Automate Your Battery for TOU Arbitrage: If you have a battery, go into your Tesla, Enphase, or EG4 app and set it to “Time of Use” or “Cost Saving” mode. Program in your utility’s exact rate schedule. The battery will now charge from solar during the day, and completely discharge to power your house from 4 PM to 9 PM, ensuring you never buy grid power at premium rates.
- Monitor Inverter Clipping: Installers often pair 400W panels with 300W microinverters. This is normal and called the DC-to-AC ratio. However, on perfect, cool, sunny days, your system will “clip” (cap out at the inverter’s max). Monitor your daily graphs. If you are clipping for 5 hours a day, your LCOE is suffering, and your installer undersized your inverters.
- Account for Degradation: Panels degrade at about 0.5% per year. By year 20, they will produce 90% of their day-one power. Do not buy a system that only exactly covers your 2026 usage; oversize the array by 10% to 15% to account for panel degradation and future EV purchases.
Limitations & Who Should Avoid This Entirely
I wouldn’t recommend this if you fall into one of the following categories. In these cases, staying strictly with grid power is the smartest financial move.
- You Plan to Move in Under 5 Years: The upfront capital cost of solar takes roughly 6 to 9 years to pay off. If you move before then, you are relying on the equity bump of your home to recoup the cost, which is highly variable depending on local real estate markets.
- You Have Heavy, Unmitigable Shade: If your roof is surrounded by 80-foot oak trees, your cloudy weather performance and shading losses will decimate your solar yield. Do not let a salesman convince you that “ambient light” will be enough. It won’t. Stick to the grid.
- Your Roof Needs Replacing Soon: If your asphalt shingles are 15 years old, do not put solar on them. You will have to pay a crew $3,000 to remove the panels in five years to redo the roof, and another $3,000 to reinstall them, completely destroying your ROI. Replace the roof first.
Extra Deep-Dive: Does a Home Battery Actually Save You Money Under NEM 3.0?
The biggest shift in the 2026 solar market is the death of 1:1 Net Metering. Many homeowners ask me: “Grid batteries cost $10,000. Do they actually save me money, or are they just expensive backup power?”
Let’s do a deep dive into the real-world economics of batteries under new utility policies.
Before NEM 3.0, if your solar panels generated an extra 10 kWh of power at noon, you sent it to the grid, and the utility credited your account $0.30 per kWh (a $3.00 credit). You then used that $3.00 credit at night to run your TV and fridge for free. The grid was your battery.
Under NEM 3.0 (and similar policies rolling out in the Carolinas, Arizona, and parts of the Midwest), the utility now says, “We will only pay you wholesale rates for your exported power.” So, that 10 kWh of excess solar is now credited at just $0.05 per kWh (a $0.50 credit). But at night, they still charge you $0.30 per kWh to buy power back. You are losing a massive amount of money on the spread.
This is where the home battery transforms from a luxury into a financial necessity. By installing a battery, you intercept that excess 10 kWh of power at noon before it ever hits the grid. You store it locally. When the sun goes down, your house automatically pulls from the battery. You successfully avoid buying power from the grid during their expensive 4 PM to 9 PM peak windows.
While a battery adds $10,000 to your upfront cost, it saves you from being financially slaughtered by the utility’s Time-of-Use rates every single evening. In my field tests, an optimized solar-plus-battery system under NEM 3.0 achieves ROI about two to three years faster than a solar-only system, simply by avoiding peak grid export losses. Yes, the battery drain from the hybrid inverter will cost you a tiny bit of efficiency, but the macroeconomic savings are undeniable.
Frequently Asked Questions (FAQs)
Does solar power completely eliminate my utility bill?
No. Even if you produce 100% of your own power, almost all utilities charge a mandatory “grid connection fee” or “customer charge” that ranges from $10 to $30 a month. You will always have a small grid bill unless you physically sever your connection to the utility line.
How does cloudy weather performance impact my reliance on the grid?
Solar panels require irradiance (sunlight) to generate voltage. On heavy overcast days, your production will drop by 50% to 80%. Unless you have a massive battery bank to bridge these multi-day weather events, your system will seamlessly pull power from the grid to keep your house running.
If the grid goes down, will my solar panels keep my house running?
Only if you have a battery or a specialized islanding inverter (like the Enphase IQ8 with sunlight backup). Standard grid-tied solar systems are legally required to shut down during a blackout to prevent back-feeding lethal electricity into the power lines while linemen are making repairs.
Is it better to finance solar or pay cash?
Paying cash is always mathematically superior because you avoid dealer fees and high interest rates. Solar loans in 2026 often include hidden “dealer fees” that can inflate the principal cost of the system by 15% to 25%. If you must finance, look for a local credit union or a Home Equity Line of Credit (HELOC) rather than a direct solar loan.
What happens to my solar panels at the end of their 25-year warranty?
They don’t instantly stop working. A Tier-1 solar panel will still produce about 85% of its original rated capacity at year 25. You can leave them on your roof generating free power for another decade, though you may need to replace the inverter, which usually has a lifespan of 12 to 15 years.
How accurate are utility smart meters compared to my solar app?
Utility smart meters are revenue-grade and highly accurate. If your solar app (like Tesla or Enphase) shows different numbers than your utility bill, it is almost always due to improper installation of the CT clamps in your main breaker panel. The clamps may be installed backward, leading to wildly inaccurate reporting of imported vs. exported energy.
Final Expert Opinion & Recommendation
When you strip away the political noise and the aggressive sales tactics, the solar power vs. grid power cost comparison in 2026 comes down to basic math. The utility grid is a monopoly. You are renting your electricity, and the landlord has the legal right to raise the rent by 5% to 8% every single year for the rest of your life.
Buying a residential solar power system allows you to pre-purchase the next 25 years of electricity at a fixed, deeply discounted wholesale rate. Yes, the upfront cost is a bitter pill to swallow, and yes, dealing with permitting and hybrid inverter battery drain requires a level of technical patience.
But the math does not lie. If you live in an area with high electricity rates, have a relatively unshaded roof, and plan to stay in your home for at least seven years, I highly recommend purchasing a solar-plus-battery system. Do not lease. Do your own ROI math using conservative 4% utility inflation estimates, demand high-quality hardware like Enphase or EG4, and take control of your home’s energy infrastructure. The grid isn’t getting any cheaper, and it certainly isn’t getting any more reliable. Take the leap.
Have you received a solar quote recently that seems too good to be true? Drop your system size, battery capacity, and total cost in the comments below, and I’ll give you a brutally honest evaluation of whether you are getting a good deal!
6 Game-Changing Solar Bluetooth Speakers (Waterproof + Outdoor Tested 2026)

I am Ethan Brooks is an author dedicated to exploring sustainability, technology, and forward-thinking solutions. His writing highlights simple yet powerful ways to improve everyday life while protecting the planet. He believes knowledge can drive meaningful change. Discover more at ecopowersence.com.